By Matt Johnson, publisher of Urban Dynamics – The Future of Science and Policy, Guest Columnist
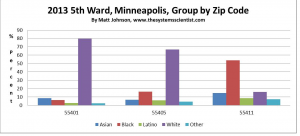
Over the next five articles, I am going to share with you some interesting patterns I’ve discovered in the 5th ward. In this first article, we well look at the difference in the population percentage with respect to the top four “racial” groups in Minneapolis – Asian, Black, Latino, and White.
In the second article, we will look at the unemployment rates between the zip codes of the 5th Ward – 55401, 55405, and 55411. In the third, we will look at the contrast of foreclosures between the 55401, 55405, and 55411 zip codes, and there is quite a difference. In the fourth article, we will look at the education levels between the three zip codes. And finally in the fifth and last article, we will bring everything together to illustrate these clear and striking differences and what they may tell us about the patterns of the 5th Ward with respect to the sub-system of the 5th Ward and the general system of Minneapolis.
In contrast, we see that “black” residents are the largest population in the 55411. And drawing on our knowledge from previous articles, we know that the percent of median household incomes greater than $75 thousand is much much lower for “black” residents than it is for “white” residents overall in the City of Minneapolis.
We also know that the 55411 has the lowest percentage of median household income earners greater than $75 thousand in the City of Minneapolis. We also know from American history that “black” Americans were partitioned into undesired neighborhoods in the northern industrial cities during the Great Migration from about 1920 to 1940.
And we also know that for the vast majority of American history, “black” Americans have been partitioned from economic and political opportunities either by bondage, redlining policies including parks, schools, and other city services, and so on and so forth. So given this information, what should we expect to find when we look at a depressed part of an American city?
Should we find a difference between the number of “black” and “white” residents? Should a depressed part of town have a higher percentage of American citizens who are “black?” Should this same part of town have higher foreclosure rates when compared to other more affluent parts of town? It wouldn’t be unreasonable for these more affluent parts of town to be mostly “white,” would it?
Should we expect to find a difference in unemployment rates? Should we find that “black” unemployment is higher than “white” unemployment? Should we see a correlation between the unemployment rates, foreclosure rates, and what group has the highest percentage of residents? In other words, should a higher percentage of “black” residents correlate with higher unemployment rates, and higher foreclosure rates?
And finally, should we expect to see a difference in education levels? Based off this one graph, which zip code would you expect to have the highest percentage of bachelor degrees or higher? Would it be the 55401, the 55405, or the 55411?
And finally, should we expect to see a correlation between a higher percentage of “black” citizens, higher unemployment rates, higher foreclosure rates, and lower education levels? Post your comments, thoughts, and predictions below.
And remember, you can refresh your memory on some of these topics with the following articles: Comparing Zip Codes | Median Household Income for Minneapolis and Foreclosure Rates: Wards 2, 4, and 5 from 2006 to 2015.


Leave a Reply to Patterns of the 5th Ward: Unemployment Cancel reply